Investors sitting through Incubator or Accelerator demo days have three metrics to judge fledgling startups – 1) great looking product demos, 2) compelling PowerPoint slides, and 3) a world-class team.
We think we can do better.
We now have the tools, technology and data to take incubators and accelerators to the next level. Teams can prove their competence and validate their ideas by showing investors evidence that there’s a repeatable and scalable business model. And we can offer investors metrics to play Moneyball – with the Investment Readiness Level.
Here’s how.
————–
We’ve spent the last 3 years building a methodology, classes, an accelerator and software tools and we’ve tested them on ~500 startups teams.
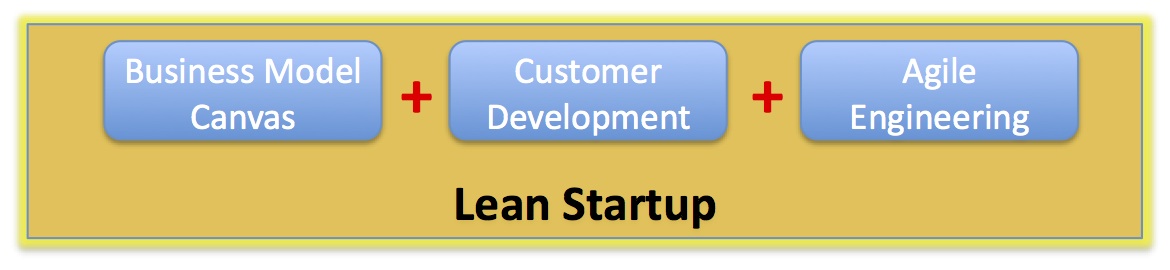
- A Lean Startup methodology offers entrepreneurs a framework to focus on what’s important: Business Model Discovery. Teams use the Lean Startup toolkit: the Business Model Canvas + Customer Development process + Agile Engineering. These three tools allow startups to focus on the parts of an early stage venture that matter the most: the product, product/market fit, customer acquisition, revenue and cost model, channels and partners.
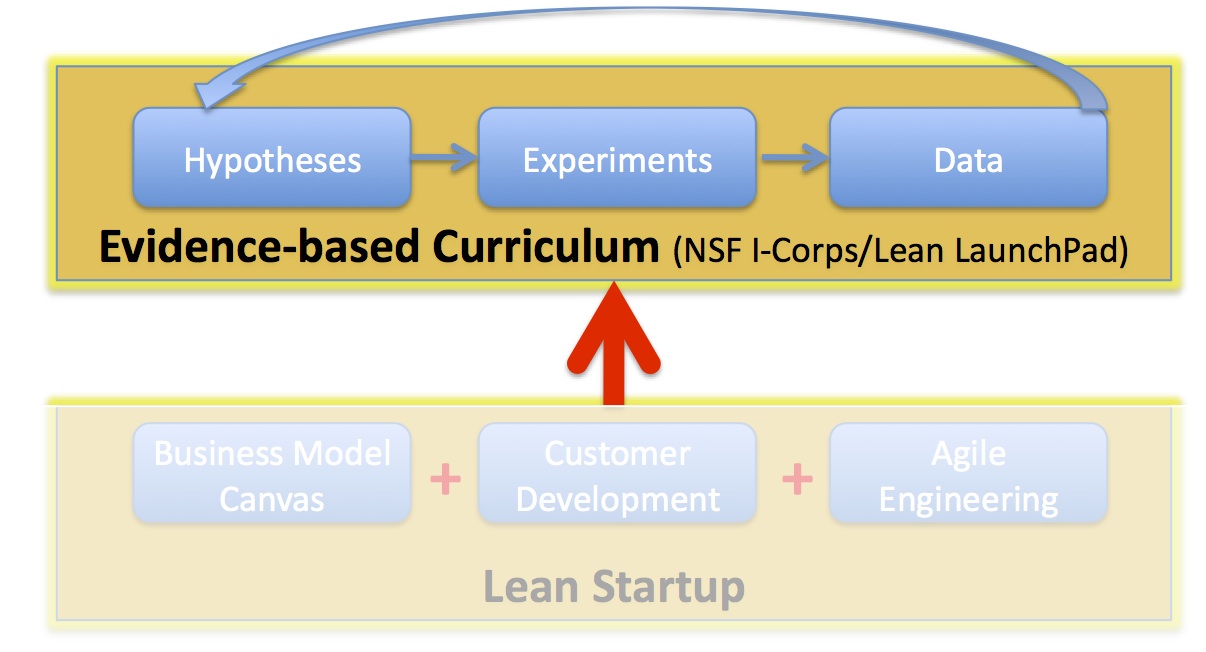
- An Evidence-based Curriculum (currently taught in the Lean LaunchPad classes and NSF Innovation Corps accelerator). In it we emphasize that a) the data needed exists outside the building, b) teams use the scientific method of hypothesis testing c) teams keep a continual weekly cadence of:
- Hypothesis – Here’s What We Thought
- Experiments – Here’s What We Did
- Data – Here’s What We Learned
- Insights and Action – Here’s What We Are Going to Do Next
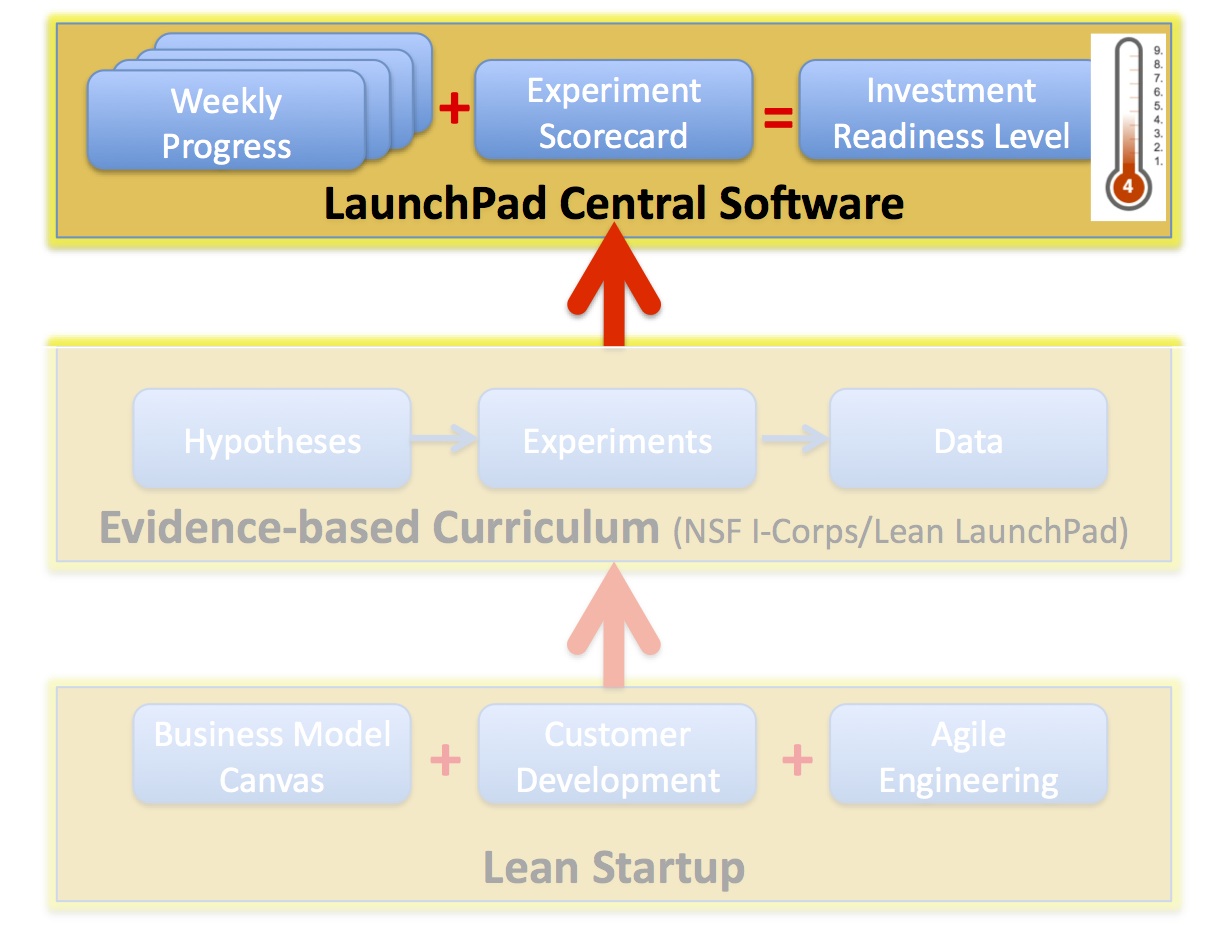
- LaunchPad Central software is used to track the business model canvas and customer discovery progress of each team. We can see each teams hypotheses, look at the experiments they’re running to test the hypotheses, see their customer interviews, analyze the data and watch as they iterate and pivot.
We focus on evidence and trajectory across the business model. Flashy demo days are great theater, but it’s not clear there’s a correlation between giving a great PowerPoint presentation and a two minute demo and building a successful business model. Rather than a product demo – we believe in a “Learning Demo”. We’ve found that “Lessons Learned” day showing what the teams learned along with the “metrics that matter” is a better fit than a Demo Day.
“Lessons Learned” day allows us to directly assess the ability of the team to learn, pivot and move forward. Based on the “lessons learned” we generate an Investment Readiness Level metric that we can use as part of our “go” or “no-go” decision for funding.
Some background.
NASA and the Technology Readiness Level (TRL)
In the 1970’s/80’s NASA needed a common way to describe the maturity and state of flight readiness of their technology projects. They invented a 9-step description of how ready a technology project was. They then mapped those 9-levels to a thermometer.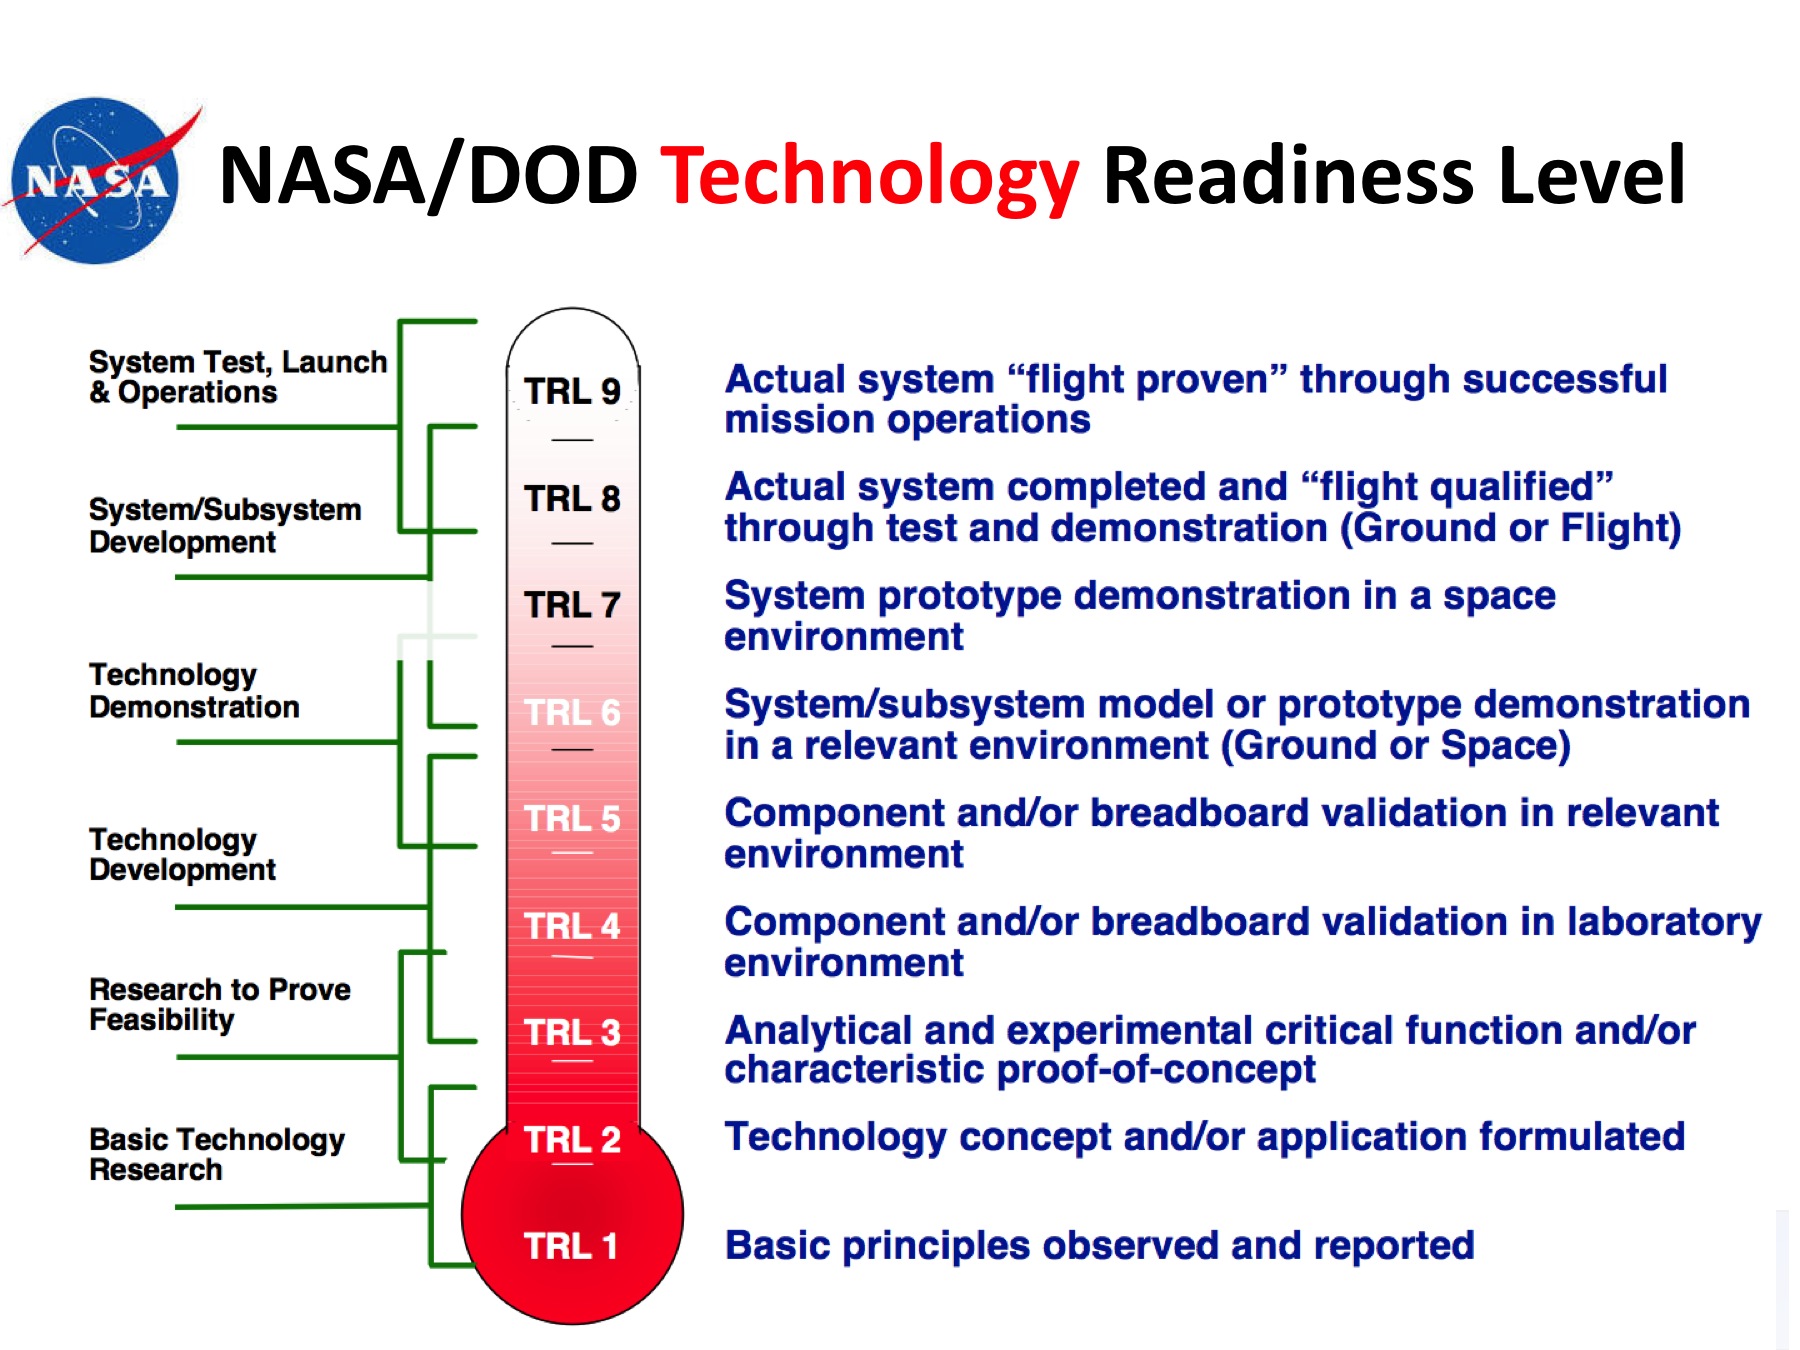
What’s important to note is that the TRL is imperfect. It’s subjective. It’s incomplete. But it’s a major leap over what was being used before. Before there was no common language to compare projects.
The TRL solved a huge problem – it was a simple and visual way to share a common understanding of technology status. The U.S. Air Force, then the Army and then the entire U.S. Department of Defense along with the European Space Agency (ESA) all have adopted the TRL to manage their complex projects. As simple as it is, the TRL is used to manage funding and go/no decisions for complex programs worldwide.
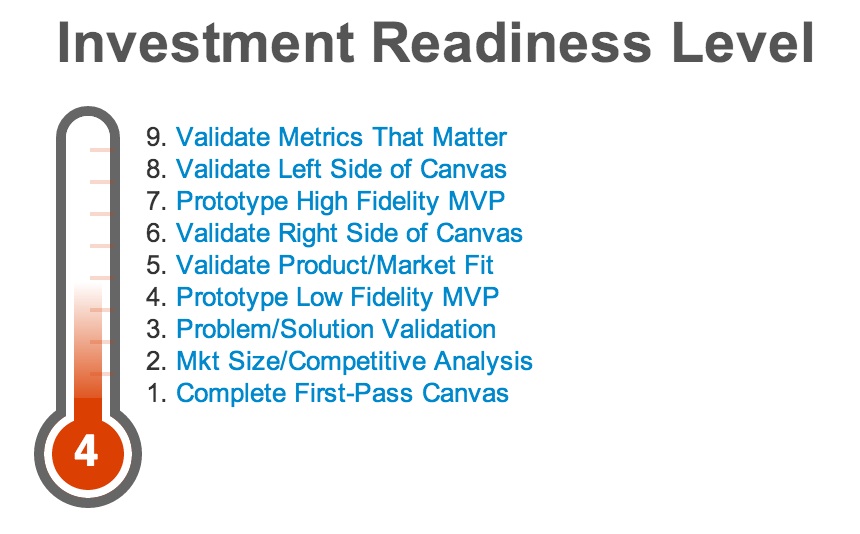
We propose we can do the same for new ventures – provide a simple and visual way to share a common understanding of startup readiness status. We call this the Investment Readiness Level .
The Investment Readiness Level (IRL)
The collective wisdom of venture investors (including angel investors, and venture capitalists) over the past decades has been mostly subjective. Investment decisions made on the basis of “awesome presentation”, “the demo blew us away”, or “great team” is used to measure startups. These are 20th century relics of the lack of data available from each team and the lack of comparative data across a cohort and portfolio.
Those days are over.
Hypotheses testing and data collection
We’ve instrumented our startups in our Lean LaunchPad classes and the NSF I-Corps incubator using LaunchPad Central to collect a continuous stream of data across all the teams. Over 10 weeks each team gets out and talks to 100 customers. And they are testing hypotheses across all 9 boxes in the business model canvas.
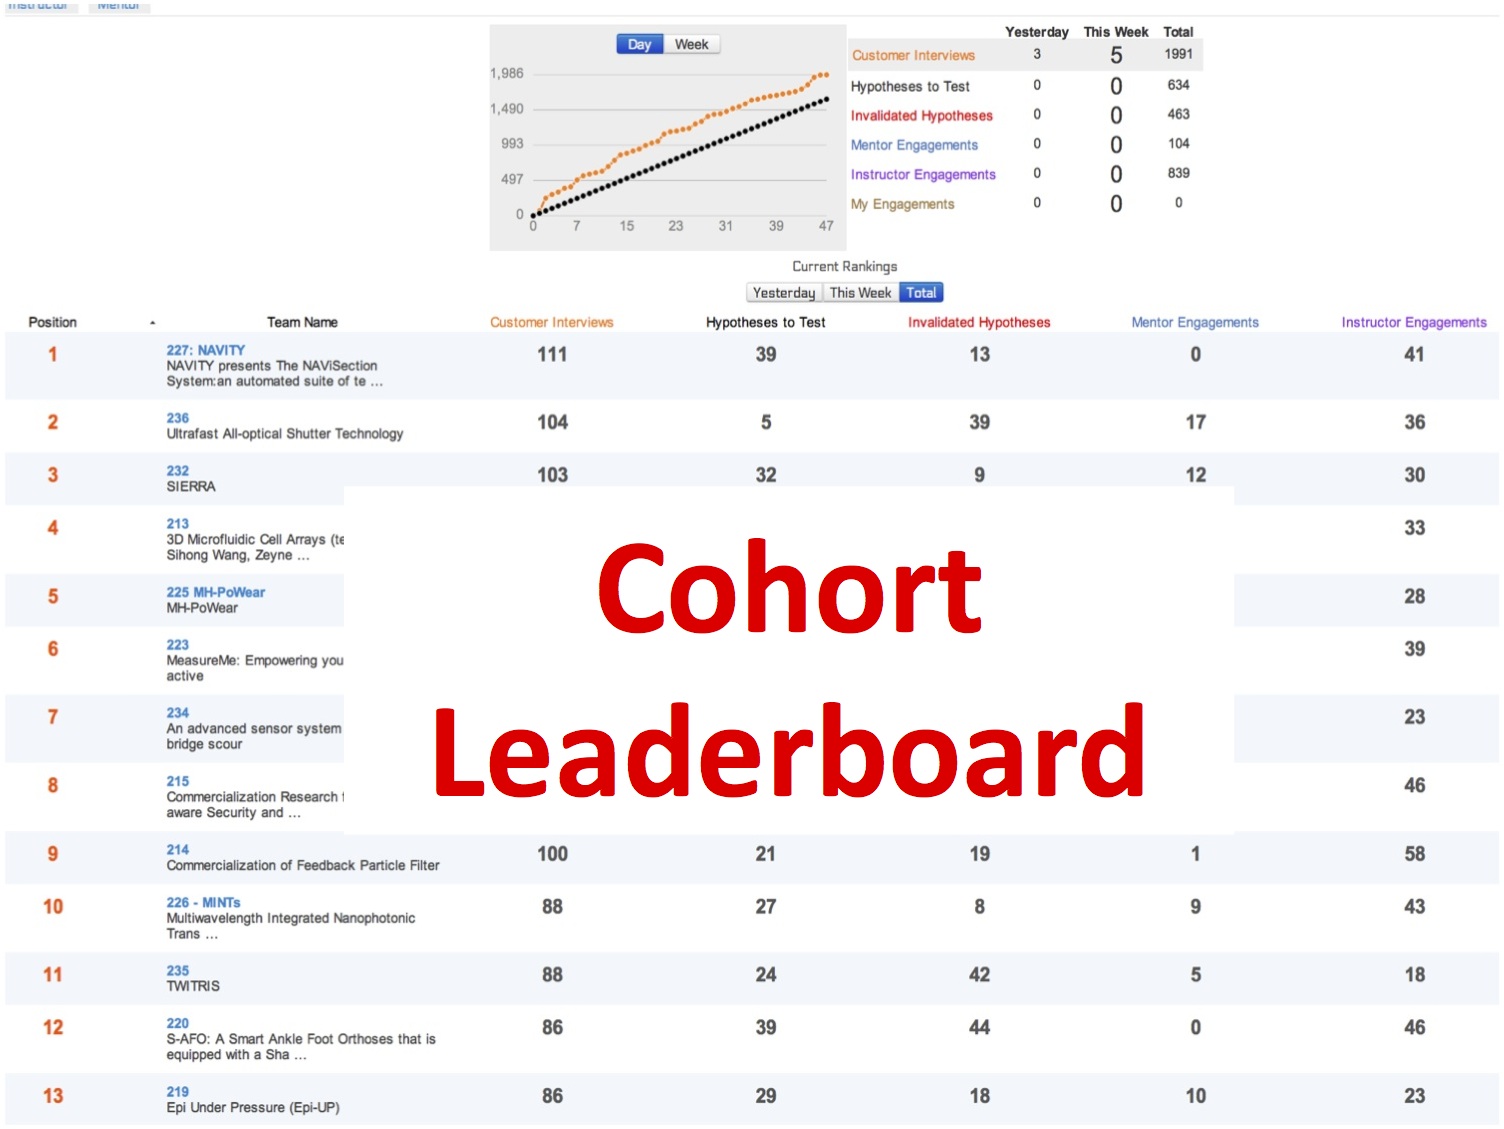
We collect this data into a Leaderboard (shown in the figure below) giving the incubator/accelerator manager a single dashboard to see the collective progress of the cohort. Metrics visible at a glance are number of customer interviews in the current week as well as aggregate interviews, hypotheses to test, invalidated hypotheses, mentor and instructor engagements. This data gives a feel for the evidence and trajectory of the cohort as a whole and a top-level of view of each teams progress.
Next, we have each team update their Business Model Canvas weekly based on the 10+ customer interviews they’ve completed.
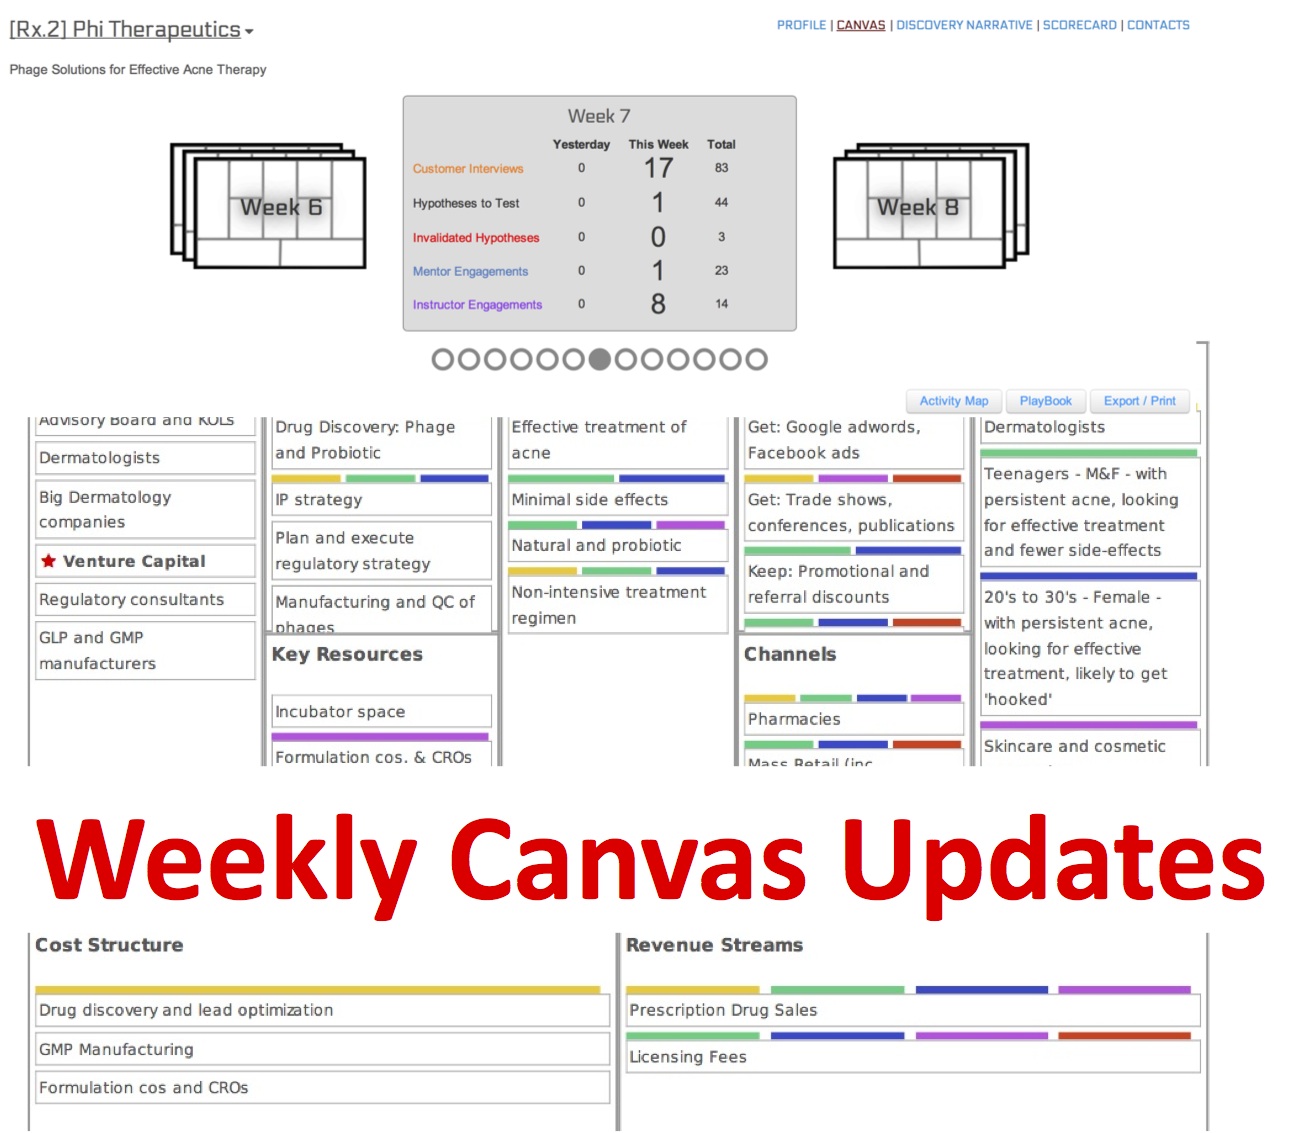
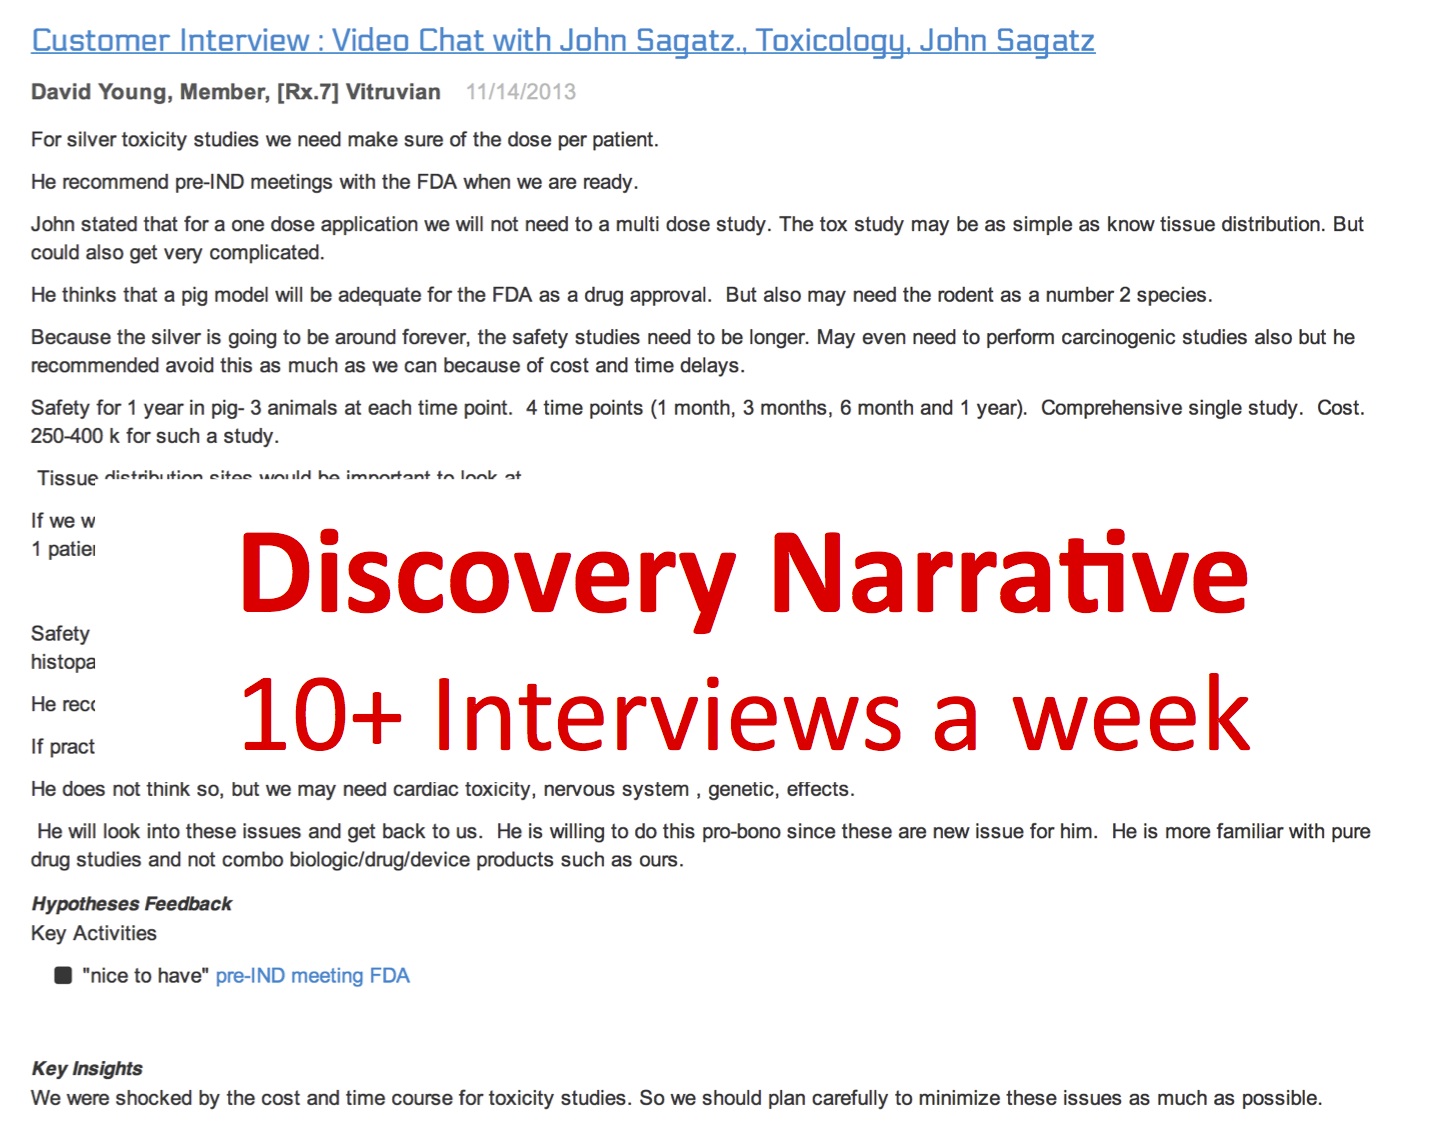
The canvas updates are driven by the 10+ customer interviews a week each team is doing. Teams document each and every customer interaction in a Discovery Narrative. These interactions provide feedback and validate or invalidate each hypothesis.
Underlying the canvas is an Activity Map which shows the hypotheses tested and which have been validated or invalidated.

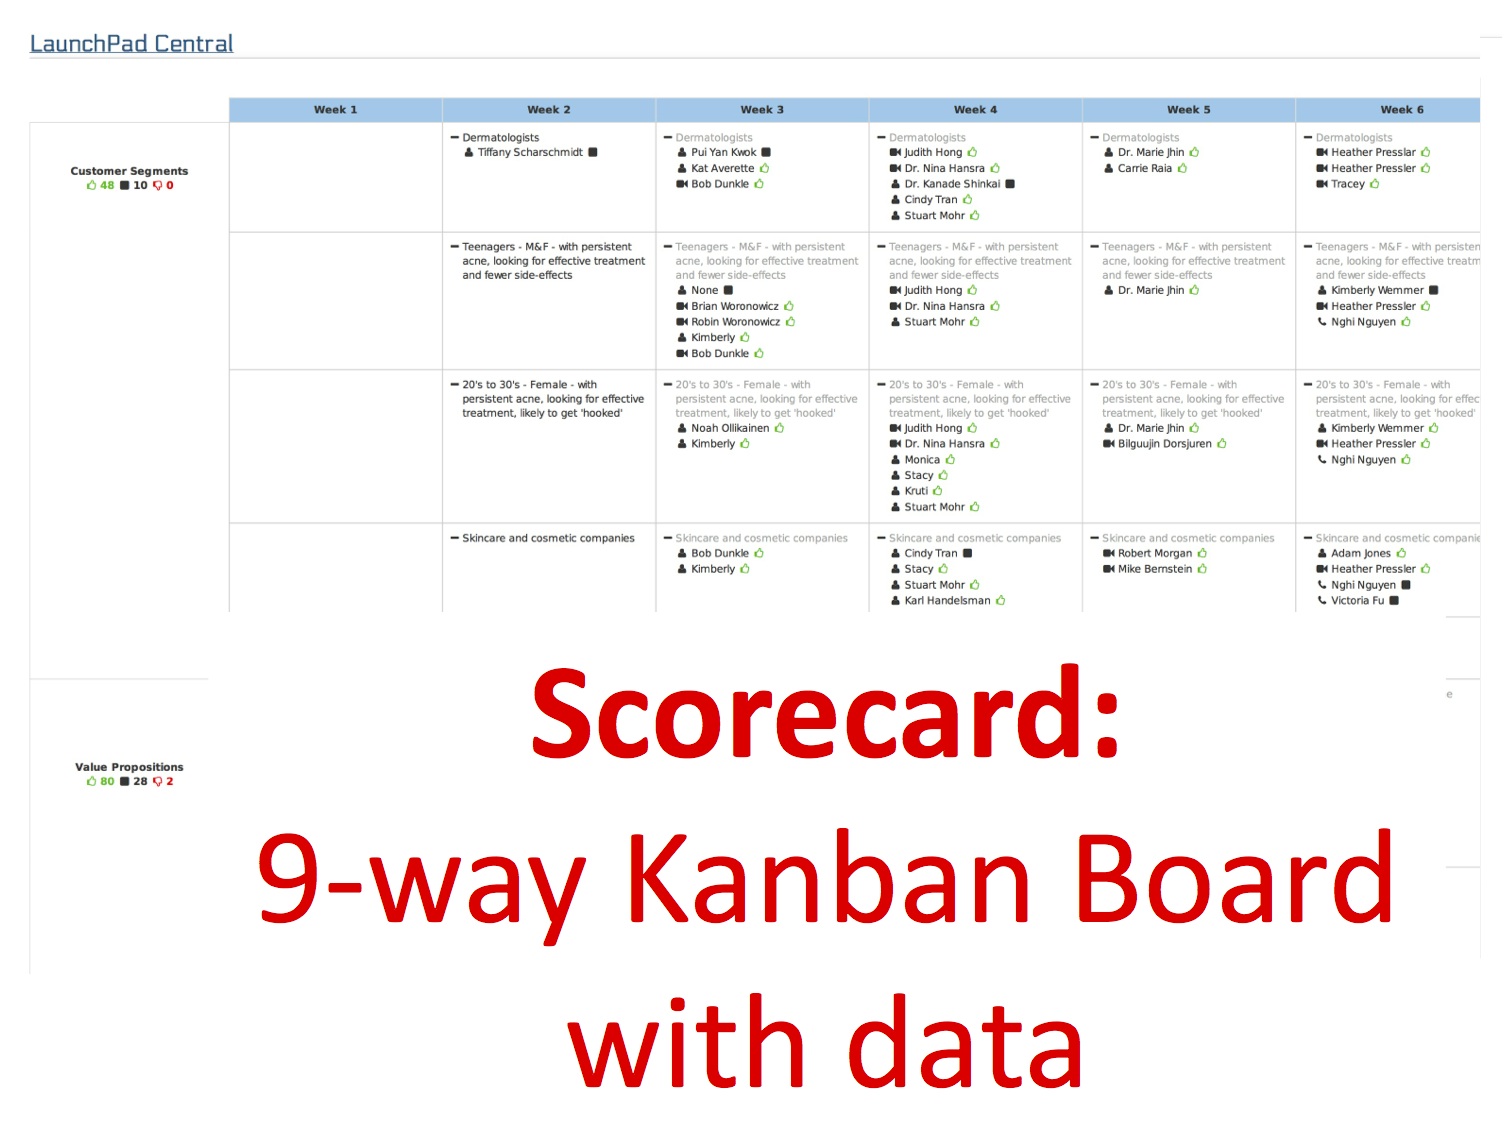
All this data is rolled into a Scorecard, essentially a Kanban board which allows the teams to visualize the work to do, the work in progress and the work done for all nine business model canvas components.
Finally the software rolls all the data into an Investment Readiness Level score.
MoneyBall
At first glance this process seems ludicrous. Startup success is all about the team. Or the founder, or the product, or the market – no metrics can measure those intangibles.
Baseball used to believe that as well. Until 2002 – when the Oakland A’s’ baseball team took advantage of analytical metrics of player performance to field a team that competed successfully against much richer competitors.
Statistical analysis demonstrated that on-base percentage and slugging percentage were better indicators of offensive success, and the A’s became convinced that these qualities were cheaper to obtain on the open market than more historically valued qualities such as speed and contact. These observations often flew in the face of conventional baseball wisdom and the beliefs of many baseball scouts and executives.
By re-evaluating the strategies that produce wins on the field, the 2002 Oakland A’s spent $41 million in salary, and were competitive with the New York Yankees, who spent $125 million.
Our contention is that the Lean Startup + Evidence based Entrepreneurship + LaunchPad Central Software now allows incubators and accelerators to have a robust and consistent data set across teams. While it doesn’t eliminate great investor judgement, pattern recognitions skills and mentoring – it does provide them the option to play Moneyball.
This post first appeared on Steve Blank’s blog on Nov. 25, 2013.